
Every failed delivery costs an average of $17.78 in direct expenses. For a mid-size operation handling 140,000 orders annually, even a 5% failure rate translates to losses approaching $200,000 per year. Those numbers get worse when you factor in the downstream damage: 23% of consumers refuse to reorder after a failed delivery, and 21% lose trust in the retailer entirely.
Today, delivery performance is a competitive battleground. Your on-time delivery KPI is the metric that tells you whether your operation is winning or losing that battle. Yet most fleet managers either measure it incorrectly, measure it too infrequently, or fail to act on what the data reveals.
This guide covers the OTD formula, industry benchmarks by sector, and a step-by-step framework for measuring and improving your on-time delivery rate using route optimization, real-time tracking, and delivery performance metrics that drive results.
Table of Contents
- What Is an On-Time Delivery KPI?
- Why On-Time Delivery Rate Matters for Your Business
- How to Measure and Improve Your On-Time Delivery KPI
- Common Challenges That Hurt On-Time Delivery Performance
- Best Practices for Maintaining a High On-Time Delivery Rate
- How Route Optimization and Real-Time Tracking Improve OTD
- Tools and Technology for Tracking On-Time Delivery KPIs
- Track and Improve Your On-Time Delivery KPI With Upper
- Frequently Asked Questions
What Is an On-Time Delivery KPI?
An on-time delivery KPI measures the percentage of deliveries that arrive within the promised time window. While the concept sounds straightforward, how you define “on time” has a significant impact on the accuracy and usefulness of this metric. Getting the definition wrong means your data tells a misleading story about your actual delivery performance.
How On-Time Delivery Is Calculated
The OTD formula is: (On-Time Deliveries / Total Deliveries) x 100
The result is your on-time delivery rate expressed as a percentage. If your fleet completed 950 out of 1,000 deliveries within the promised delivery time windows, your OTD rate is 95%.
The critical factor is defining what counts as “on time.” This means within the committed delivery window, not just the same calendar day. Common measurement pitfalls include counting early deliveries when customers were unavailable, including canceled orders in the total, and using ship dates instead of actual delivery timestamps.
OTD vs. OTIF vs. DIFOT
- OTD measures timeliness only. It answers one question: Did the delivery arrive within the promised window?
- OTIF (On-Time In-Full) is a stricter metric that measures both timeliness and order completeness. A delivery that arrives on time but with missing items fails the OTIF standard.
- DIFOT (Delivery In-Full On-Time) adds delivery accuracy, damage-free condition, and correct documentation to the criteria. It is the most comprehensive of the three metrics.
For courier and last-mile fleets, OTD is typically the primary metric. Distribution operations benefit from tracking OTIF, while enterprises with complex supply chains often use DIFOT for end-to-end measurement.
Understanding how your on-time delivery KPI is defined sets the foundation. The next step is understanding why it deserves top-priority attention in your operation.
Why On-Time Delivery Rate Matters for Your Business
On-time delivery rate is not just a logistics metric. It directly impacts customer retention, brand reputation, and bottom-line profitability. Businesses that track and act on their on-time delivery rate consistently outperform competitors in both customer satisfaction and operational cost control.
Customer Retention and Revenue Impact
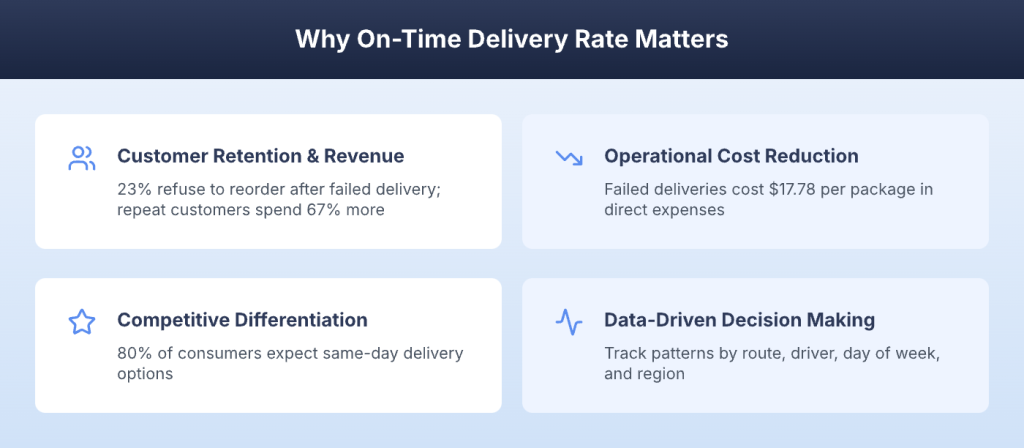
Research shows that 23% of consumers refuse to reorder after a failed delivery. Another 21% lose trust in the retailer after a late delivery, making future purchases less likely. Repeat customers spend 67% more than new customers, which means every late delivery creates a compounding revenue loss that extends far beyond the single failed order.
The connection between how to improve delivery time and customer lifetime value is direct: faster, more reliable deliveries keep customers coming back.
Operational Cost Reduction
Failed deliveries cost an average of $17.78 per package in direct expenses. That figure covers redelivery attempts, customer service calls, refund processing, and replacement shipments. These hidden costs accumulate quickly. Fleets with 95%+ OTD rates spend significantly less on exception handling because fewer deliveries require follow-up action.
Competitive Differentiation
Consumer expectations continue to rise, with 80% now expecting same-day delivery options. Meeting promised time windows is table stakes for staying competitive. OTD rate is increasingly used in B2B contract evaluations and SLAs, where a single percentage point can determine whether you win or lose a contract. High OTD rates create a reputation advantage that compounds over time as word-of-mouth and review scores improve.
Data-Driven Decision Making
Tracking your on-time delivery KPI reveals patterns in late deliveries by route, driver, day of the week, and region. Instead of guessing why deliveries are late, you get data that enables root cause analysis. This level of visibility creates accountability across the delivery team and surfaces last-mile delivery metrics that inform scheduling, staffing, and territory decisions.
Understanding why OTD matters is the first step. Measuring and improving it requires a structured approach that addresses both the data collection and the operational changes needed to move the needle.

See it in action
See Your Fleet's On-Time Performance Instantly
Upper's Smart Analytics dashboard tracks your OTD rate by driver, route, and time period with zero manual spreadsheets.

How to Measure and Improve Your On-Time Delivery KPI
Measuring OTD accurately is the foundation, but the real value comes from using that data to identify bottlenecks and make targeted improvements. This section covers both sides: getting the measurement right and turning those numbers into better on-time delivery performance.
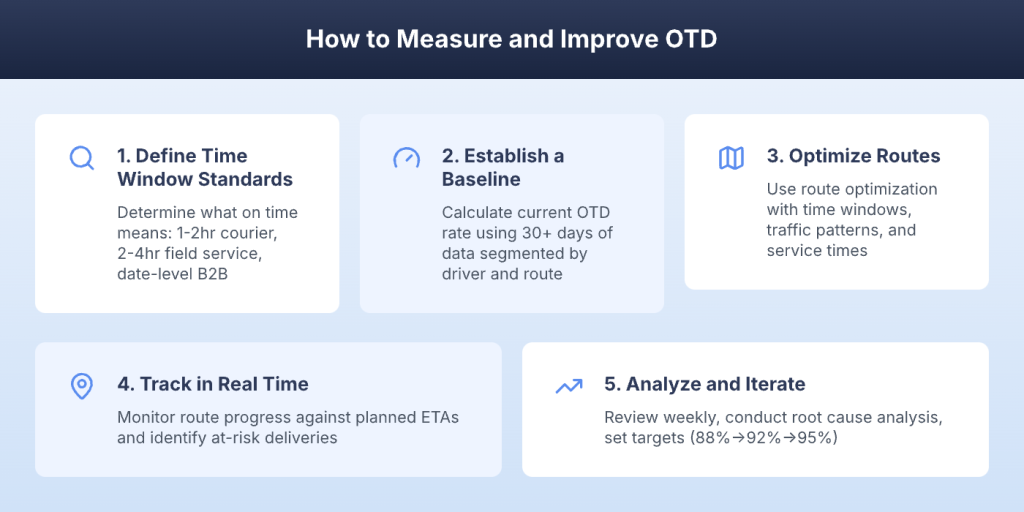
Step 1: Define Your Time Window Standards
Before you can measure anything, determine what “on time” means for your operation. A delivery that arrives at 10:47 a. m. might be on time for a business with a 2-hour window but late for one that promised a 30-minute slot.
Set different standards for different service types if your operation spans multiple delivery categories. Document the definition so every team member, from dispatch to drivers, uses the same criteria when evaluating performance.
Setting Realistic Time Windows by Service Type
Courier and package delivery operations typically work within 1 to 2 hour windows. Field service businesses run 2 to 4 hour windows to account for variable service times. B2B distribution usually operates on date-level or half-day windows. Food delivery requires the tightest precision, with 15 to 30-minute windows being standard.
Step 2: Establish a Measurement Baseline
Calculate your current OTD rate using at least 30 days of delivery data. A shorter window does not provide enough data to account for weekly patterns and seasonal variations.
Segment the data by driver, route, day of week, and region to find performance patterns. This segmentation reveals where your worst-performing segments are so you can target improvements where they will have the most impact.
Common Measurement Mistakes to Avoid
Counting canceled or rescheduled deliveries inflates your total and skews the percentage. Using estimated ship dates instead of confirmed delivery timestamps gives you inaccurate readings. Mixing time window definitions across different calculations makes comparisons meaningless.
The most dangerous mistake is averaging fleet-wide rates without segmenting. This creates what logistics professionals call the “watermelon KPI” problem: the number looks green on the outside, but when you cut it open, specific routes, drivers, or regions are deep in the red.
Step 3: Optimize Routes for Time Window Compliance
Use route optimization with time windows to build routes that respect every delivery commitment. Optimization algorithms factor in delivery windows, not just shortest distance, ensuring that time-sensitive stops get priority in the route sequence.
Factor in realistic service times at each stop, not just drive times. A route that accounts only for travel between addresses ignores the 5 to 15 minutes spent parking, walking to the door, waiting for the recipient, and capturing proof of delivery.
Account for traffic patterns and loading times in route calculations. When same-day changes occur, re-optimize rather than manually adjusting, which often creates cascading delays.
How Route Optimization Directly Impacts OTD
Algorithmic sequencing eliminates backtracking that causes cascading delays across the route. Time-aware routing prioritizes stops with tight delivery windows, ensuring those commitments are met first. Multi-driver optimization balances workloads across the fleet to prevent any single driver from becoming overloaded, which is one of the most common causes of late delivery in fleet operations.
Step 4: Track Deliveries in Real Time
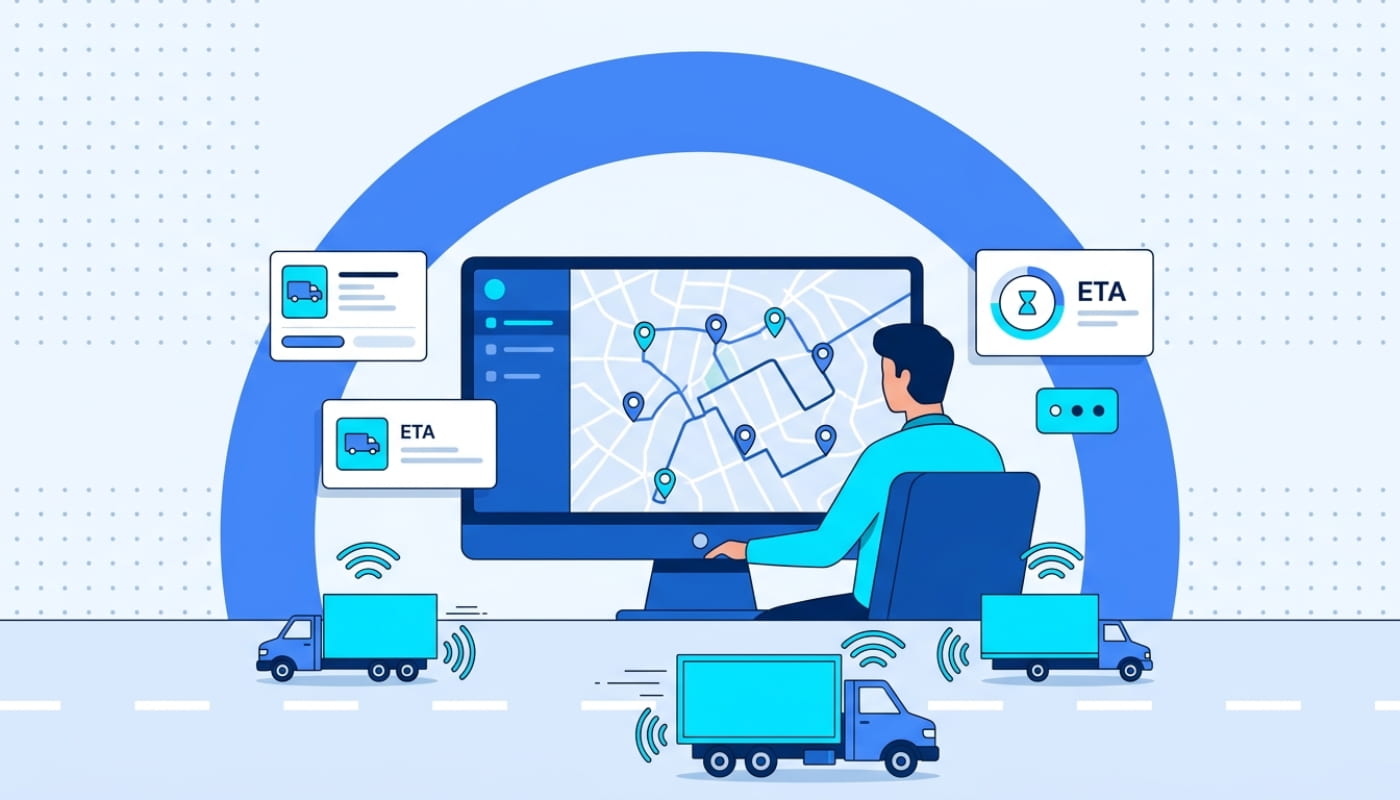
Monitor route progress against planned ETAs throughout the day. Real-time GPS tracking lets dispatchers see exactly where every driver is, which stops have been completed, and which deliveries are at risk of going late.
Identify at-risk deliveries before they become late. When a driver falls behind schedule, dispatchers can reassign stops or adjust the route sequence to protect the remaining time windows. Proactively notify customers when delays are unavoidable, which reduces the perception of lateness and preserves satisfaction.
Use GPS tracking data to verify actual arrival times versus planned times. This gives you accurate OTD data based on real timestamps instead of driver self-reports.
Real-Time Visibility and Proactive Intervention
Live driver tracking reveals when a driver is falling behind schedule before it becomes a missed delivery. Dispatchers can reassign stops or adjust routes mid-day to redistribute workload. Automated customer notifications reduce the impact of minor delays by keeping recipients informed about updated arrival times.
Step 5: Analyze and Iterate
Review OTD data weekly, not just monthly. Monthly reviews catch problems too late, after patterns have already cost you customers and revenue. Weekly cadence gives you time to spot trends and make adjustments before small issues become systemic.
Track trends over time to confirm that improvements are holding or to catch regressions early. Conduct root cause analysis on every cluster of late deliveries, looking for common factors like specific routes, time periods, or stop types.
Set incremental improvement targets. Moving from 88% to 95% OTD does not happen overnight. Target 88% to 92% in the first quarter, then 92% to 95% in the next. This approach keeps the team motivated and the goals achievable.
Building a Continuous Improvement Loop
Weekly OTD review meetings with dispatch and driver teams create accountability and surface frontline insights that data alone might miss. Driver-level scorecards, built on delivery driver performance data, show each team member where they stand. Pattern analysis answers the critical question: Are late deliveries concentrated on certain days, routes, or stop types?
Even with a strong measurement and improvement process, certain challenges will test your OTD rate repeatedly. Recognizing these obstacles helps you build resilience into your operation.
See it in action
Build Time-Window Routes for Your Entire Fleet
Upload your stops, set delivery windows, and get optimized routes that keep every driver on schedule in under a minute.
Common Challenges That Hurt On-Time Delivery Performance
Maintaining a high on-time delivery rate is not a set-and-forget effort. Delivery operations face constant variables that can erode OTD performance, from external disruptions to internal process gaps. Recognizing these challenges is the first step toward building resilience into your delivery operation.
Unpredictable Traffic and Weather
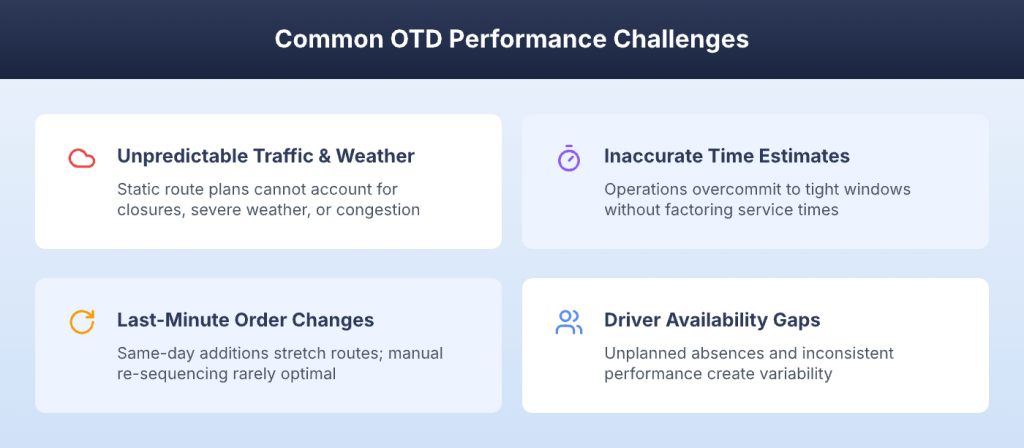
Real-time conditions change routes and timelines without warning. Static route plans built the night before cannot account for a highway closure, severe weather, or unexpected congestion. Seasonal weather patterns create recurring OTD dips that are predictable in aggregate but difficult to manage on any given day.
Inaccurate Time Window Estimates
Overcommitting to tight time windows without factoring in realistic service times sets your fleet up for failure. Many operations do not account for parking, building access, loading and unloading time, or customer interactions at each stop. Using uniform time estimates instead of location-specific data means some stops will always run behind.
Last-Minute Order Changes
Same-day additions stretch existing routes beyond capacity. Cancellations waste pre-planned driving time that could have been allocated to other stops. Priority changes force route re-sequencing under time pressure, and manual adjustments rarely produce optimal results.
Driver Availability and Performance Gaps
Unplanned driver absences force route redistribution across remaining team members, increasing everyone’s workload. Inconsistent driver speeds and service times create variability that is hard to plan around. New drivers need more time per stop while they learn routes and procedures, which impacts fleet-wide OTD during onboarding periods.
Addressing these challenges requires a combination of better planning tools, standardized processes, and real-time adaptability. The following best practices provide a framework for building that operational resilience.
Best Practices for Maintaining a High On-Time Delivery Rate
Businesses that consistently achieve 95%+ on-time delivery rates share common operational habits. These best practices go beyond technology adoption. They require process discipline and a culture of accountability across the delivery team.
Build Buffer Time Into Routes
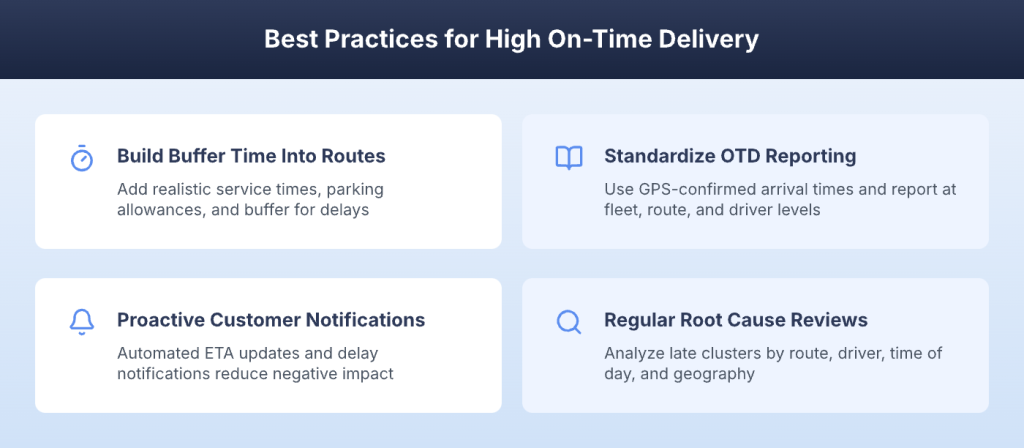
Add realistic service times and parking allowances to every stop. Include buffer between stops for unexpected delays like traffic incidents or longer-than-expected customer interactions. Plan routes based on end-of-day variability, not just average conditions, so your team stays on schedule even when things do not go perfectly.
Standardize Your OTD Definition and Reporting
Document exactly what counts as “on time” across your organization. Use consistent time sources, specifically GPS-confirmed arrival times rather than driver self-reports. Report OTD at fleet, route, and driver levels weekly to maintain visibility into delivery efficiency at every level of the operation.
Use Customer Notifications Proactively
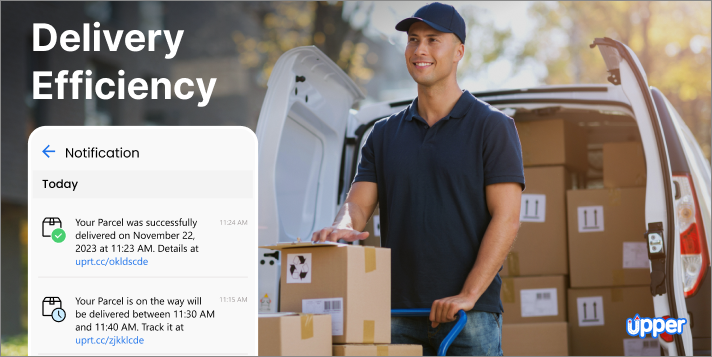
Automated ETA updates set accurate expectations and reduce the negative impact of minor delays. Proactive delay notifications turn a potentially negative experience into one where customers feel informed and respected. Post-delivery confirmations close the loop and build trust for future orders.
Conduct Regular Root Cause Reviews
Analyze late delivery clusters by route, driver, time of day, and geography. Address systemic issues, such as consistently late afternoon routes that suggest overloaded schedules. Share findings with drivers to create feedback loops that improve performance from the ground up.
The right technology stack makes these best practices significantly easier to sustain at scale. The next section covers how route optimization and real-time tracking work together to support consistently high OTD rates.
See it in action
Re-Optimize Routes When Plans Change
Upper adjusts routes in real time for last-minute orders, cancellations, and traffic so your OTD rate stays protected.
How Route Optimization and Real-Time Tracking Improve OTD
Manual route planning and spreadsheet-based tracking make it nearly impossible to maintain high on-time delivery rates as delivery volumes grow. Route optimization software combined with real-time GPS tracking gives fleet managers the tools to plan realistic routes, monitor progress, and intervene before deliveries go late.
Time-Aware Route Optimization
Algorithms that factor in delivery windows, not just shortest distance, build routes designed for time window compliance. Workload balancing across drivers prevents schedule overload that leads to cascading delays. Re-optimization capabilities handle same-day route changes without forcing dispatchers to manually rebuild sequences.
GPS Tracking and Dispatch Visibility
Real-time location data enables proactive delay management instead of reactive firefighting. Dispatchers can reassign stops when a driver falls behind, keeping the fleet on schedule even when individual routes encounter problems. GPS-confirmed arrival times provide accurate OTD data instead of estimates or self-reported timestamps.
Analytics and Performance Dashboards
On-time delivery rate tracked automatically per driver, route, and time period using an analytics dashboard eliminates manual data compilation. Trend analysis reveals whether improvements are holding or performance is regressing. Driver scorecards create accountability without micromanaging, giving each team member visibility into their own performance.
Automated Customer Notifications
ETA updates reduce the impact of minor delays on customer satisfaction by keeping recipients informed. Delivery confirmations provide documentation for OTD calculations and create a clear record. Proactive communication builds trust even when delays occur, which protects your customer relationships during imperfect delivery days.
Choosing the right platform depends on your fleet size, delivery type, and operational priorities. The next section covers the technology landscape for OTD tracking.
Tools and Technology for Tracking On-Time Delivery KPIs
The technology landscape for delivery performance management has expanded significantly. From standalone KPI dashboards to integrated delivery management platforms, fleet managers have multiple options for tracking and improving their on-time delivery rate.
Route Optimization Platforms
All-in-one solutions like Upper Route Planner combine route planning, dispatch, tracking, and analytics in a single platform. Built-in time window constraints and workload balancing ensure routes are designed for OTD compliance from the start. These platforms are best for fleets that want a single system for both planning and performance tracking, eliminating the need to stitch data together from multiple tools.
Fleet Telematics and GPS Systems
Hardware-based tracking provides detailed vehicle and driver data including speed, idle time, and route deviation. Integration with route planning enables actual versus planned route comparison for precise OTD measurement. These systems are best for fleets that need vehicle diagnostics alongside delivery tracking.
Business Intelligence and Reporting Tools
Custom dashboards pull data from multiple sources and create advanced visualizations for trend analysis and executive reporting. These tools are best for organizations with dedicated analytics teams that want to build custom OTD reporting alongside other business metrics.
TMS and ERP Integrations
Transportation management systems with built-in OTD reporting serve enterprise operations with complex supply chains. ERP modules handle supply-chain-level OTD tracking that spans from the warehouse to the final delivery. These are best for enterprise operations where on-time delivery KPI tracking needs to connect across multiple systems and departments.
Regardless of the technology stack, the fundamentals remain the same: define your standard, measure accurately, and act on the data. The right tool makes execution easier, but the strategy drives the results.
Track and Improve Your On-Time Delivery KPI With Upper
A high on-time delivery rate does not happen by accident. It requires optimized routes that respect delivery windows, real-time visibility into driver progress, and analytics that reveal exactly where performance is falling short.
Upper combines route optimization with time window constraints, real-time GPS tracking, and Smart Analytics to give fleet managers everything they need to measure and improve their OTD rate from a single platform. Routes are built to honor every delivery commitment, factoring in traffic patterns, service times, and driver workloads so your team starts every day with a realistic, achievable plan.
Smart Analytics tracks your on-time delivery rate automatically per driver, route, and time period. Instead of compiling spreadsheets at the end of every week, you get a clear picture of where performance is strong and where it needs attention. Automated customer notifications keep recipients informed with accurate ETAs, reducing support calls and protecting satisfaction even on imperfect delivery days.
Book a demo to see how Upper can help your fleet hit 95%+ on-time delivery rates consistently.
Frequently Asked Questions
A good on-time delivery rate is 95% or higher. World-class operations in e-commerce and manufacturing target 98%+. Performance between 85% and 94% is acceptable but indicates room for improvement, while anything below 85% signals systemic issues that need immediate attention.
The on-time delivery KPI formula is: (Number of On-Time Deliveries / Total Number of Deliveries) x 100. For accurate results, exclude canceled orders, use actual delivery timestamps rather than ship dates, and apply a consistent definition of “on time” across all calculations.
OTD (On-Time Delivery) measures only whether deliveries arrive within the promised time window. OTIF (On-Time In-Full) is a stricter metric that measures whether deliveries arrive on time and with the complete, correct order. OTIF is more common in manufacturing and distribution, where order accuracy matters as much as timeliness.
Track on-time delivery daily for operational awareness, review trends weekly with your dispatch and driver teams, and report at the monthly or quarterly level for strategic planning. Weekly reviews are the minimum cadence for identifying and addressing performance issues before they become patterns.
Common causes include unoptimized routes that create unnecessary drive time, inaccurate time window estimates, last-minute order changes that overload existing routes, traffic and weather disruptions, and driver availability issues. Most late deliveries trace back to planning gaps rather than driver performance.
Route optimization algorithms build delivery sequences that factor in time windows, traffic patterns, service times, and driver workloads. This prevents the cascading delays that occur with manual route planning, where one late stop pushes every subsequent delivery past its window.
Industry benchmarks vary by sector. E-commerce targets 95-98%, manufacturing supply chains average 90-94% with leaders at 95%+, and retail distribution considers 93-95% good performance. Geographic coverage also affects benchmarks, as urban routes typically achieve higher OTD rates than rural deliveries.