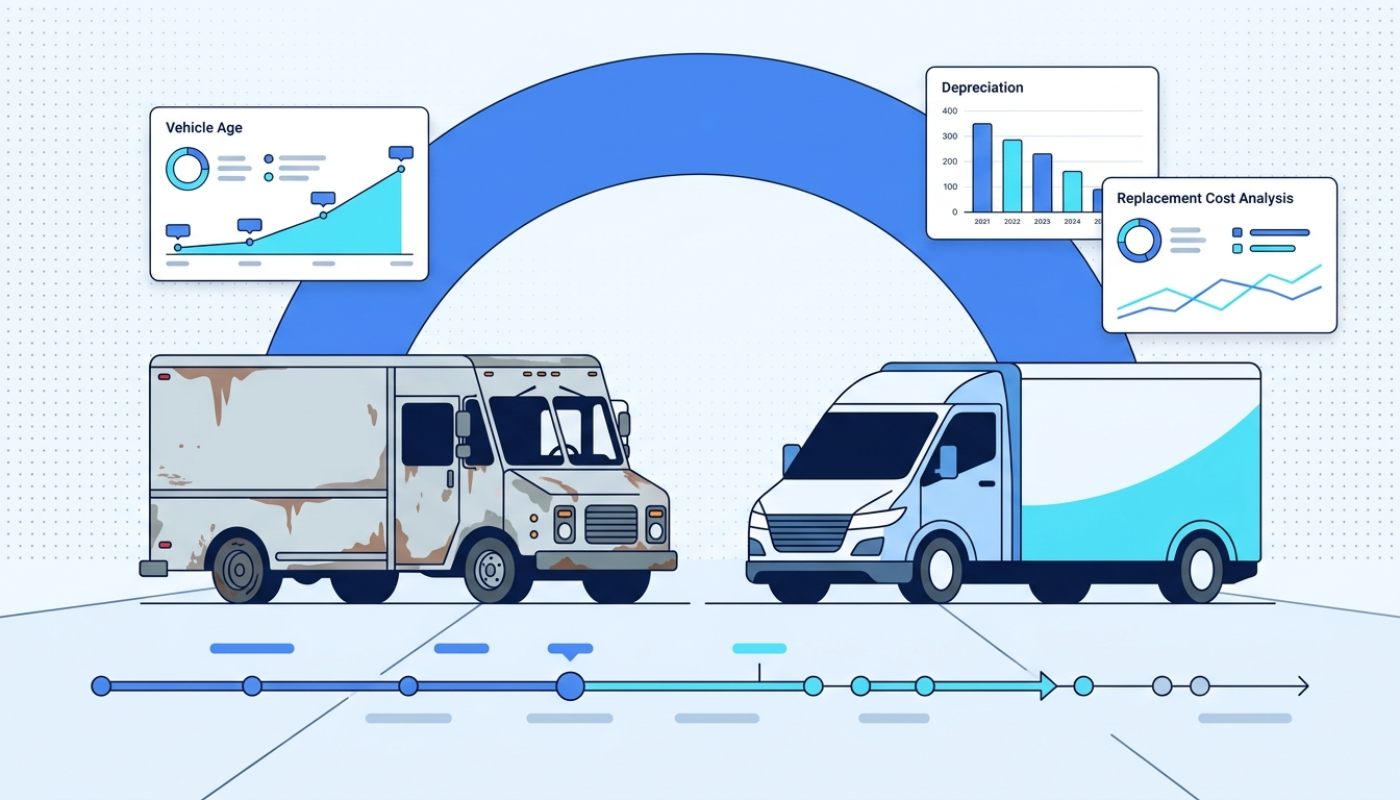
Fleet vehicles are depreciating assets, and keeping them too long costs more than replacing them on time. Waiting until a vehicle is completely inoperable before retiring it turns a planned capital decision into an emergency expense. Without a structured fleet replacement strategy, businesses face ballooning maintenance bills, rising fuel costs, and safety risks that compound monthly.
The consequences hit hard. Vehicles over 10 years old cost 35% more per mile to operate than newer equivalents. Unplanned breakdowns pull vehicles off the road and disrupt delivery schedules. Every dollar spent keeping an aging truck running is a dollar not invested in a more reliable replacement.
This guide covers how to build a data-driven fleet replacement strategy, calculate the total cost of ownership, identify the right replacement triggers, evaluate common approaches, and use operational visibility to decide when to retire, repair, or replace.
Table of Contents
- What Is a Fleet Replacement Strategy?
- Types of Replacement Strategies
- Why Fleet Replacement Strategy Is Important
- Benefits of an Effective Fleet Replacement Strategy
- Key Factors to Consider in Fleet Replacement
- How to Build an Effective Fleet Replacement Strategy
- Common Fleet Replacement Strategies
- Signs It’s Time to Replace a Fleet Vehicle
- Challenges in Fleet Replacement Planning (and How to Overcome Them)
- Best Practices for Fleet Replacement Strategy
- The Role of Operational Visibility in Fleet Replacement Decisions
- How Upper Helps You Make Smarter Fleet Replacement Decisions
- FAQs on Fleet Replacement Strategy
What Is a Fleet Replacement Strategy?
A fleet replacement strategy is a structured approach to determining when and how to replace fleet vehicles for optimal cost and performance. It determines which vehicles to replace, when to pull the trigger, and how to fund the transition.
Rather than reacting to breakdowns or running trucks until they fail, a fleet replacement strategy uses performance data, cost trends, and business needs to make proactive replacement decisions. The goal is to replace vehicles at the point where keeping them costs more than replacing them.
Key Objectives of a Fleet Replacement Strategy
Every effective fleet replacement strategy targets three outcomes:
- Minimize total cost of ownership (TCO). This includes purchase price, maintenance, fuel, insurance, and depreciation across the vehicle’s lifecycle.
- Maintain operational efficiency. Vehicles must be reliable enough to meet daily delivery demands without excessive downtime.
- Ensure safety and compliance. Aging vehicles may lack modern safety features or fail to meet emissions and regulatory standards.
Types of Replacement Strategies
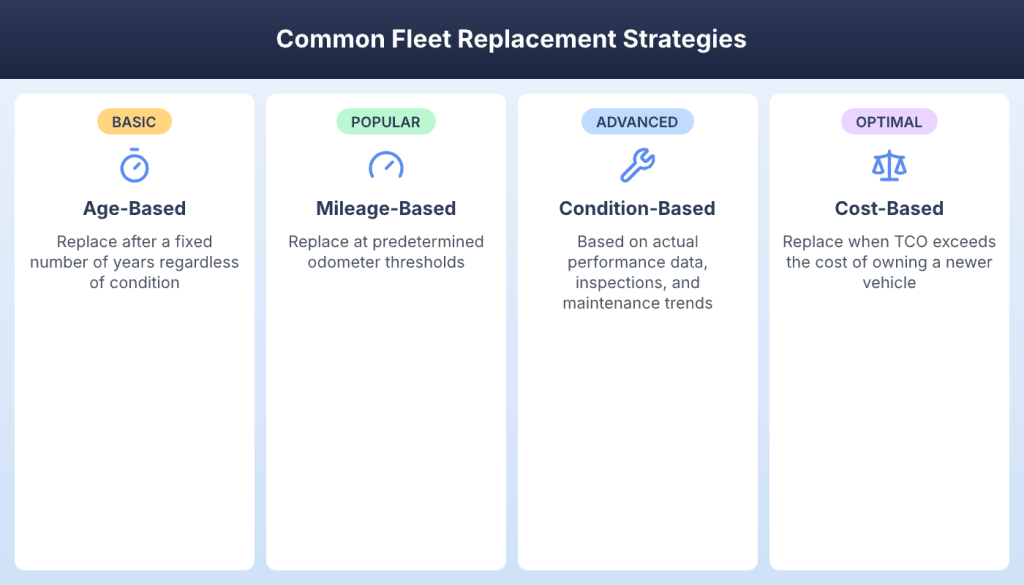
There are four primary approaches, each with different data requirements:
- Age-based replacement. Vehicles are replaced after a fixed number of years, regardless of condition.
- Mileage-based replacement. Replacement triggers at specific odometer thresholds.
- Condition-based replacement. Decisions are based on actual vehicle performance, maintenance history, and inspection results.
- Lifecycle cost-based replacement. Vehicles are replaced when annual operating costs exceed the cost of owning a newer vehicle.
Most high-performing fleets combine two or more approaches to balance simplicity with precision.
Why Fleet Replacement Strategy Is Important
Running vehicles past their optimal replacement point is one of the most expensive mistakes a fleet manager can make.
Rising Maintenance Costs
Maintenance costs climb predictably as vehicles age. When annual maintenance exceeds 50% of a vehicle’s current market value, the vehicle costs more to keep than it is worth. That threshold is a clear replacement signal.
Declining Fuel Efficiency
Older engines burn more fuel. Newer vehicles consume 10-20% less fuel than aging equivalents, thanks to improved engine technology and aerodynamics. Across a fleet, that gap adds up to thousands of dollars annually.
Increased Downtime
Breakdowns cost revenue, not just repair money. Aging vehicles break down more often, and repairs take longer as parts become harder to source. Downtime compounds when multiple vehicles hit the failure point simultaneously.
Safety and Compliance Risks
Fleets using modern vehicles report a 15% reduction in accident rates compared to those running older equipment. Aging vehicles may also fail emissions standards or inspections, creating compliance exposure.
Financial Impact
Without a replacement plan, fleet managers face unpredictable capital expenditures. A structured fleet replacement strategy converts emergency purchases into predictable, budgetable expenses.

See it in action
Track Total Cost of Ownership with Upper
Upper's smart analytics aggregate fuel, maintenance, and route data per vehicle so you can spot rising costs early.

Benefits of an Effective Fleet Replacement Strategy
Lower Total Cost of Ownership
Replacing vehicles at the optimal point minimizes total cost per mile across the fleet. Strategic replacement keeps your fleet on the lowest possible cost curve.
Improved Fleet Reliability
Newer vehicles break down less often, meaning fewer missed deliveries, fewer emergency repairs, and fewer customer disruptions.
Better Fuel Efficiency
Modern vehicles deliver 10-20% better fuel economy than aging equivalents. Across a 20-vehicle fleet, that saves tens of thousands of dollars annually.
Enhanced Safety and Compliance
Current-model vehicles reduce accident risk by up to 15% and meet current emissions and inspection standards.
Predictable Budgeting and Planning
A structured replacement cycle converts unpredictable emergency purchases into planned capital expenditures. Finance and operations teams both benefit from reduced uncertainty.
Key Factors to Consider in Fleet Replacement
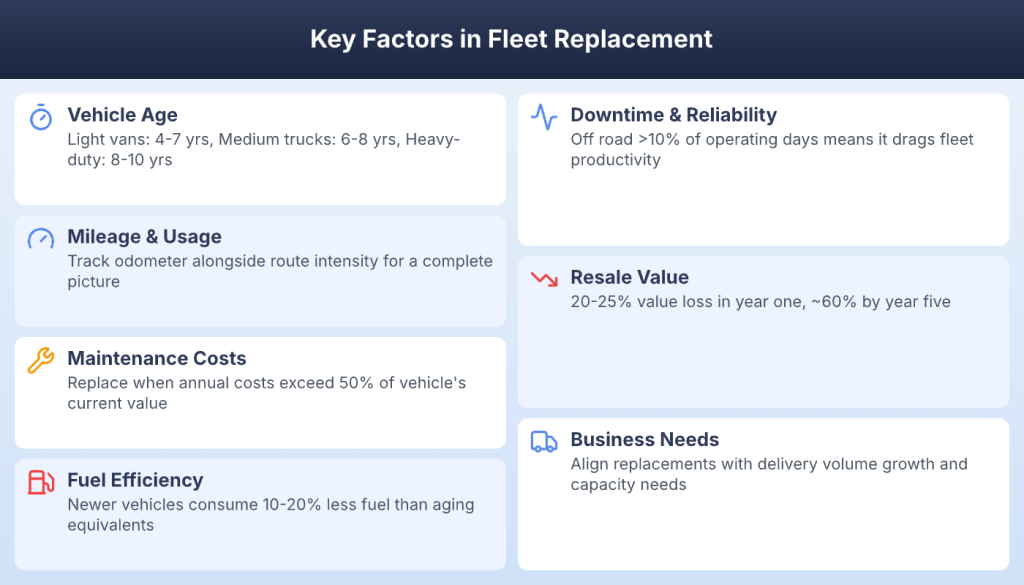
Replacement decisions should never be based on a single metric. Here are the factors that matter most.
Vehicle Age
General lifecycle benchmarks by vehicle type:
- Light-duty vans: 4-7 years or 100,000-150,000 miles
- Medium-duty trucks: 6-8 years or 150,000-200,000 miles
- Heavy-duty vehicles: 8-10 years or 250,000+ miles
Actual timing depends on usage intensity, maintenance quality, and operating conditions.
Mileage and Usage
High-mileage vehicles wear out faster, especially on urban stop-and-go routes. A delivery van making 80 stops per day in city traffic wears far faster than a highway vehicle covering the same distance. Track odometer readings alongside route intensity for a complete picture.
Maintenance and Repair Costs
Plot maintenance costs per vehicle over time. The inflection point where costs accelerate is your signal to plan replacement. Track scheduled maintenance and unplanned repairs separately.
Fuel Efficiency
When a vehicle’s fuel efficiency drops 15-20% below the fleet average for similar routes, it is burning money. Tools like smart analytics surface these trends automatically by tracking fuel data alongside route performance.
Downtime and Reliability
If a vehicle is off the road more than 10% of scheduled operating days, it drags down fleet productivity. Frequent breakdowns also stress other vehicles and drivers who absorb the extra workload.
Resale Value
Vehicles lose 20-25% of their value in year one and approximately 60% by year five. The optimal replacement window falls where declining resale value intersects with rising operating costs.
Business Needs and Demand
Fleet composition should reflect current and projected business needs. If delivery volumes are growing, replace aging vehicles with higher-capacity alternatives. Align replacement decisions with your operational roadmap.
See it in action
See Per-Vehicle Performance Data in One Dashboard
Upper tracks fuel efficiency, utilization, and route intensity for every vehicle in your fleet. The data tells you what to replace.
How to Build an Effective Fleet Replacement Strategy
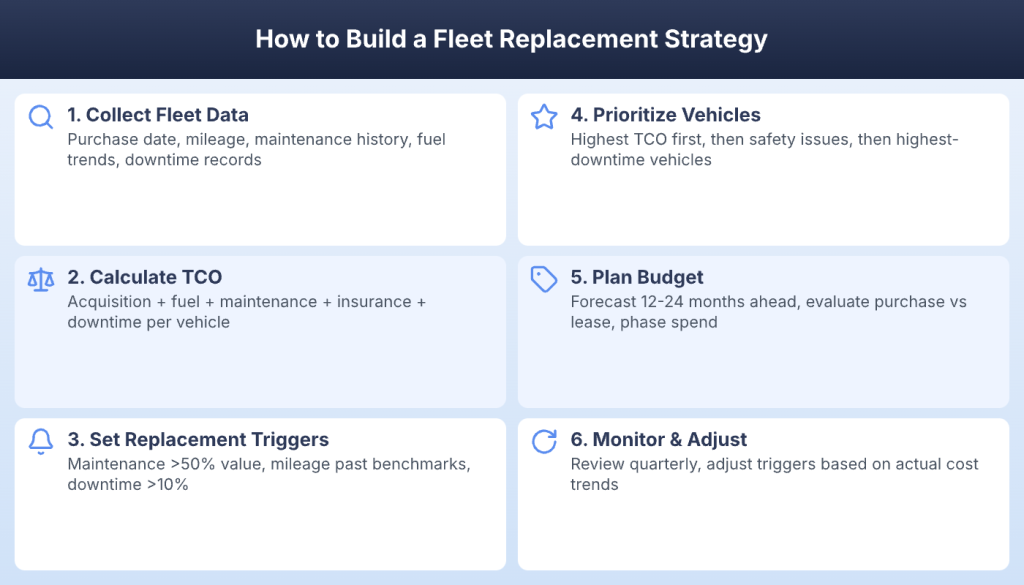
Building a fleet replacement strategy requires six steps, each building on the previous.
Step 1: Collect and Analyze Fleet Data
For each vehicle, gather purchase date, current mileage, maintenance history and costs, fuel consumption trends, downtime records, and current resale value. If you are using fleet management software, much of this data is already centralized.
Step 2: Calculate Total Cost of Ownership (TCO)
TCO includes acquisition cost, financing, fuel, maintenance, insurance, and downtime costs over the ownership period. Divide the total by months or miles to get a per-unit cost. Compare this across vehicles to identify which ones cost the most to operate.
Step 3: Identify Replacement Triggers
Set clear thresholds: annual maintenance exceeding 50% of vehicle value, mileage beyond lifecycle benchmarks, downtime exceeding 10% of operating days, or fuel efficiency dropping 15-20% below fleet average. When a vehicle hits two or more triggers, it moves to the replacement queue.
Step 4: Prioritize Vehicles for Replacement
Prioritize highest-TCO vehicles first, followed by those with safety issues, then highest-downtime vehicles. If more than 25% of your fleet is past its optimal replacement window, you have a backlog problem that requires a phased multi-year plan.
Step 5: Plan Budget and Procurement
Forecast replacement costs 12-24 months in advance. Evaluate fleet purchase vs. lease for each vehicle category. Phase replacements to avoid large single-year expenditures. Factor in resale revenue from outgoing vehicles.
Step 6: Monitor and Adjust Strategy
Review quarterly using updated performance data. Adjust triggers based on actual cost trends. Refine lifecycle benchmarks as you accumulate data on how your vehicles perform under your operating conditions.
Common Fleet Replacement Strategies
Each strategy has trade-offs. The right choice depends on your data maturity, fleet size, and operational complexity.
Age-Based Replacement
Replace vehicles after a fixed number of years, regardless of condition or mileage.
Pros
Simple to plan and budget. Predictable replacement cycles. Easy to communicate to stakeholders.
Cons
Ignores actual vehicle condition. May replace vehicles still performing well or keep high-mileage vehicles too long.
Mileage-Based Replacement
Replace vehicles when they reach a predetermined odometer reading.
Pros
Reflects actual usage. Works well for fleets with consistent route patterns. Easy to track and forecast.
Cons
Does not account for maintenance quality or operating conditions. Two vehicles at the same mileage can be in vastly different conditions.
Condition-Based Replacement
Replace vehicles based on actual performance data, inspection results, and maintenance trends.
Pros
Maximizes the useful life of each vehicle. Reduces premature replacements. Based on real performance.
Cons
Requires detailed data tracking. More complex to administer. Subjective elements can create inconsistency.
Cost-Based Replacement
Replace vehicles when their total cost of ownership exceeds the cost of owning a newer replacement.
Pros
Optimizes fleet spending at the individual vehicle level. Directly tied to financial performance.
Cons
Requires comprehensive cost tracking. More complex calculations. Needs accurate resale value estimates.
See it in action
Optimize Routes for Your Current Fleet
While you plan replacements, Upper ensures your existing vehicles run the most efficient routes possible.
Signs It’s Time to Replace a Fleet Vehicle
Increasing Maintenance Costs
When repair bills trend upward quarter over quarter and approach 50% of the vehicle’s current value, the math no longer works. A vehicle that cost $1,200 to maintain last year but is trending toward $3,000 this year needs attention now.
Frequent Breakdowns
Three or more unplanned breakdowns in a quarter signals unreliability. Each breakdown disrupts schedules, strains other vehicles, and frustrates drivers.
Reduced Fuel Efficiency
When a vehicle consistently uses 15-20% more fuel than comparable vehicles on similar routes, engine or drivetrain degradation is likely.
Safety Concerns
Failed inspections, recurring brake issues, or lack of modern safety features are non-negotiable replacement triggers.
High Downtime Impacting Operations
When a vehicle’s downtime forces you to turn away jobs or delay deliveries, it is actively harming your business. Compare revenue lost during downtime against the cost of replacement.
Challenges in Fleet Replacement Planning (and How to Overcome Them)
Limited Budget
The Challenge
Replacing multiple vehicles in a single year strains cash flow, especially for small and mid-size operations.
The Solution
Phase replacements across multiple budget cycles. Explore leasing options. Factor in resale revenue from outgoing vehicles. Some fleets use financing programs that spread costs over 36-60 months.
Lack of Data
The Challenge
Many fleets lack the granular vehicle-level data needed for confident replacement decisions.
The Solution
Invest in fleet management tools that centralize vehicle data automatically. GPS tracking captures mileage and usage patterns. Fuel card integrations track consumption per vehicle. Even partial data is better than none.
Operational Disruptions
The Challenge
Taking a vehicle out of service creates a temporary capacity gap during transition.
The Solution
Schedule replacements during low-demand periods. Phase replacements so no more than one or two vehicles transition at a time. Plan 30-60 days of lead time for procurement.
Resistance to Change
The Challenge
Drivers and teams may resist new vehicles or process changes, even when data supports replacement.
The Solution
Share maintenance cost trends, fuel comparisons, and reliability records with the team. Involve drivers in evaluating new vehicle models. Provide training on new features before deployment.
Best Practices for Fleet Replacement Strategy
Use Data-Driven Decision Making
Every replacement decision should be backed by TCO analysis, maintenance trends, and downtime records. Gut feelings miss the cost patterns that data reveals.
Monitor Total Cost of Ownership
Review the TCO quarterly for every vehicle. The vehicle with the highest TCO relative to its contribution is your next replacement candidate.
Replace Vehicles Before Costs Spike
The optimal replacement point is just before operating costs accelerate. Use historical cost curves to predict when each vehicle will hit its inflection point.
Standardize Fleet Vehicles Where Possible
Fewer vehicle makes and models simplify maintenance, parts inventory, and procurement. Standardization reduces per-vehicle costs and makes benchmarking easier.
Align Replacement with Business Growth
Replace outgoing vehicles with models that match future demand, not just current needs. Factor in territory expansion and new service types.
Integrate Replacement with Operational Planning
Coordinate with operations, finance, and HR to align replacement timing with seasonal demand, budget cycles, and driver availability.
The Role of Operational Visibility in Fleet Replacement Decisions
Why Visibility Matters
Replacement decisions require deeper insight than vehicle count and total mileage. Which routes stress vehicles the most? Which drivers are harder on equipment? Which vehicles sit idle while others are overworked? Operational visibility answers these questions.
Connecting Usage with Replacement Timing
When you can see route intensity, stop frequency, idle time, and daily mileage per vehicle, you predict wear patterns more accurately. A route optimization software with GPS tracking capabilities surfaces this usage data automatically.
Reducing Inefficiencies Before Replacing Vehicles
Before spending capital on a new vehicle, ask whether the current one is being used efficiently. Is capacity optimization reducing unnecessary trips? Sometimes the problem is operations, not the vehicle.
How Upper Helps You Make Smarter Fleet Replacement Decisions
A strong fleet replacement strategy depends on knowing how vehicles are actually performing, not guessing based on age or mileage alone. The businesses that replace at the right time have visibility into daily operations, per-vehicle costs, and usage patterns.
Upper Route Planner gives fleet managers the operational data that informs better replacement decisions. With smart analytics, you can track fuel consumption trends, route intensity, and vehicle utilization across your entire fleet. GPS tracking shows exactly how each vehicle is being used. Route optimization reduces unnecessary wear by minimizing miles driven.
Before you replace a single vehicle, Upper helps you squeeze maximum efficiency from your current fleet. Optimized routes mean less fuel burned, fewer miles driven, and reduced mechanical stress. Capacity optimization ensures optimal loads per vehicle, reducing unnecessary trips. The result is a fleet that lasts longer and costs less to operate.
When it is time to replace, Upper’s per-vehicle performance data tells you exactly which vehicles to retire first and why. No guesswork, no spreadsheets, no surprises.
Book a demo to see how Upper gives your fleet the operational visibility to make every replacement decision count.